Tuning for Throughput vs. Durability
Today's Requirement
Marketing tells you a flash sale goes live next week. Clickstream volume will jump from a trickle to tens of thousands of events per second, for hours.
Every producer setting you have used so far worked fine for 20 test messages. At flash-sale volume, the same defaults could cost real money, or become a real bottleneck.
The question is: are your producers ready?
To answer it, you need to know the settings that control the trade-off between speed and safety. Today we look at five of them. And instead of only reading about them, you will measure their effect yourself.
The Five Knobs
| Knob | What it controls |
|---|---|
linger.ms | How long messages wait in the buffer to form a batch |
batch.size | How big one batch may grow |
compression.type | Whether batches are compressed before they go over the network |
acks | How much confirmation the producer waits for |
buffer.memory and max.block.ms | How much the producer may hold in memory, and what happens when it is full |
Let's take them one at a time.
Knob 1: linger.ms — Trading a Little Latency for a Lot of Throughput
Remember what you learned about producer internals. send() does not send a message at once. The message waits in an internal buffer, and the sender thread sends messages in batches.
How long does a message wait?
That is exactly what linger.ms controls. Its default is 5 milliseconds. (Older articles say the default is 0. That changed in Kafka 4.0.)
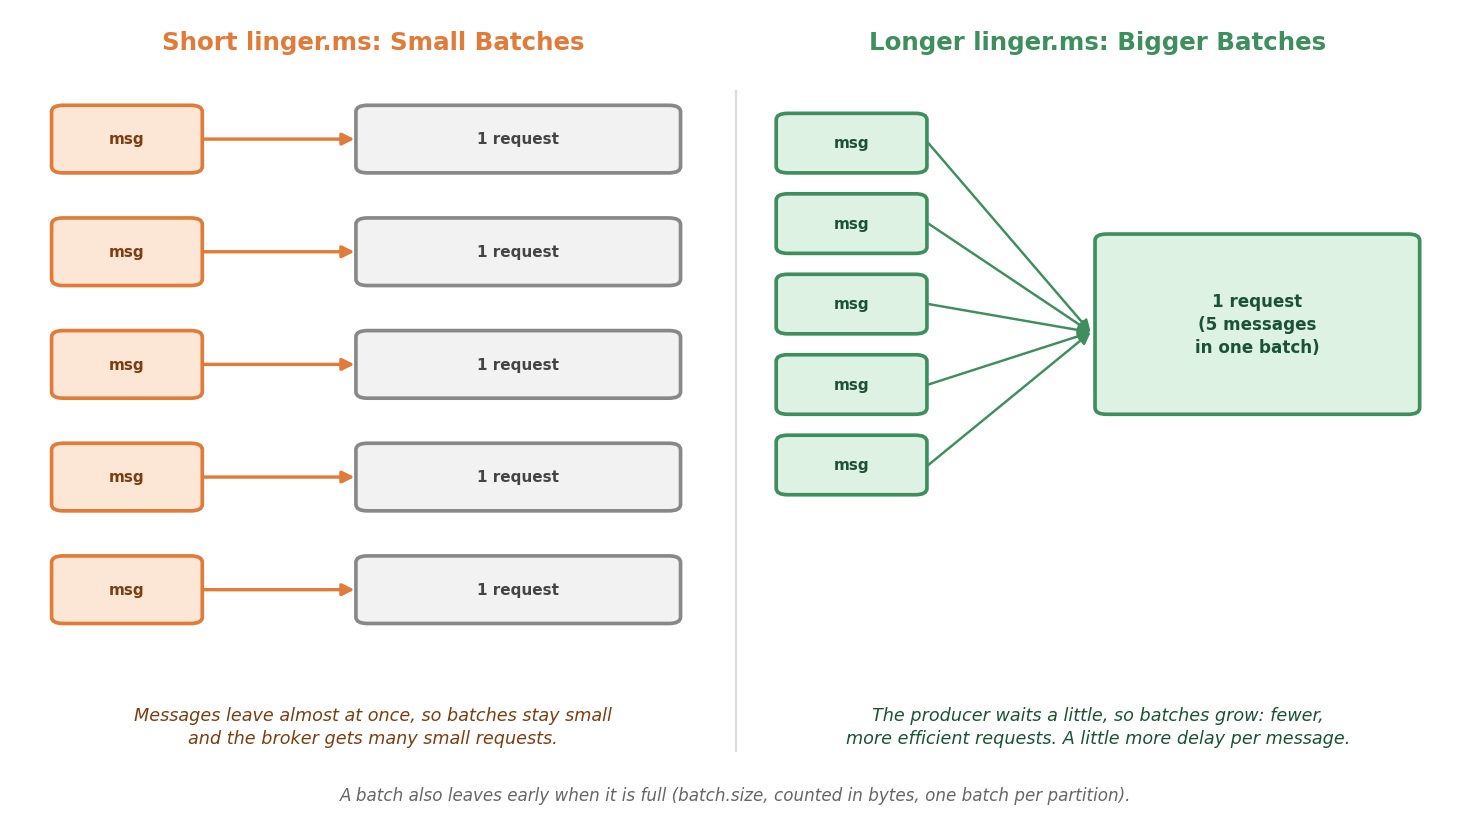 Short vs. longer linger.ms
- With a short
linger.ms, messages leave almost at once. Each message has low latency. But the batches stay small, so the broker gets many more requests. - With a longer
linger.ms, the producer waits a little longer, and more messages pile up. Then it sends them as one bigger batch. Each message waits a little longer. But you get far fewer, far more efficient requests.
Think of two numbers. In 5 ms, you may collect 50 events. In 50 ms, you may collect 2,000. Ten times the waiting time, but many times the batch size.
Even with linger.ms=0, are there no batches at all?
There are some. Messages that arrive while a request is already on its way have to wait, so they leave together in the next request. Under load, batches form by themselves. linger.ms adds a deliberate wait on top of that.
Can I make it very large, like one minute?
No. Think about it. Every message would wait up to a minute. That is bad for latency. And if you send very fast, a very high value lets messages pile up in the buffer. The buffer has limits (see Knob 5). So choose a moderate value, and test it.
Knob 2: batch.size — How Big a Batch May Get
batch.size puts an upper limit on one batch.
| Setting | Default | What it limits |
|---|---|---|
batch.size | 16,384 bytes (16 KB) | The size of one batch, per partition |
A batch is sent when the first of two things happens: linger.ms has passed, or the batch is full.
Notice that the limit is counted in bytes, not in messages. Kafka events are small. One of our click events is about 100 bytes of JSON, plus a little overhead. So a 16 KB batch holds only around 150 events.
What does this mean at flash-sale volume?
Let's do a small example. Say three partitions share 30,000 events per second. That is about 10,000 events per second for each partition, or 10 events every millisecond. A 16 KB batch, with 150 events, is full after about 15 ms. So even if linger.ms is 50, the batches leave every 15 ms, because they are full. At high volume, batch.size is the limit you hit first, and not linger.ms.
That is why a common tuning step for busy producers is to make batch.size larger, for example 64 KB or 128 KB, together with a moderate linger.ms.
Then why not make it huge?
Two reasons. The producer allocates a buffer of batch.size for each batch it starts, in anticipation of more messages. A huge value wastes memory, especially with many partitions. And very large requests are a different kind of problem. So raise it step by step, and measure. A value of 0 switches batching off completely, which you almost never want.
Knob 3: compression.type — Batching's Natural Partner
compression.type shrinks a batch before it goes over the network. The options are none (the default), gzip, snappy, lz4 and zstd.
This is not a separate decision from batching. It is the same decision, and the two help each other. Compression works on a whole batch at once. So the bigger your batches, the better the compression works. A bigger batch.size, a moderate linger.ms and a real compression codec are usually turned on together.
The price is CPU time. Compressing (and later decompressing) costs processing.
lz4andsnappyare fast. They are the common choice for high-throughput pipelines.gzipcompresses smaller, but it costs more CPU. It is a poor fit if low latency matters more than saving bytes.zstdis another good option with strong compression.
Why is the default none?
Because if your batches hold only a few small messages, compression saves almost nothing and only costs CPU. Compression pays off when batches are bigger.
Knob 4: acks — How Much Durability You Wait For
You already met acks in the last lecture. Now let's look at all three levels together.
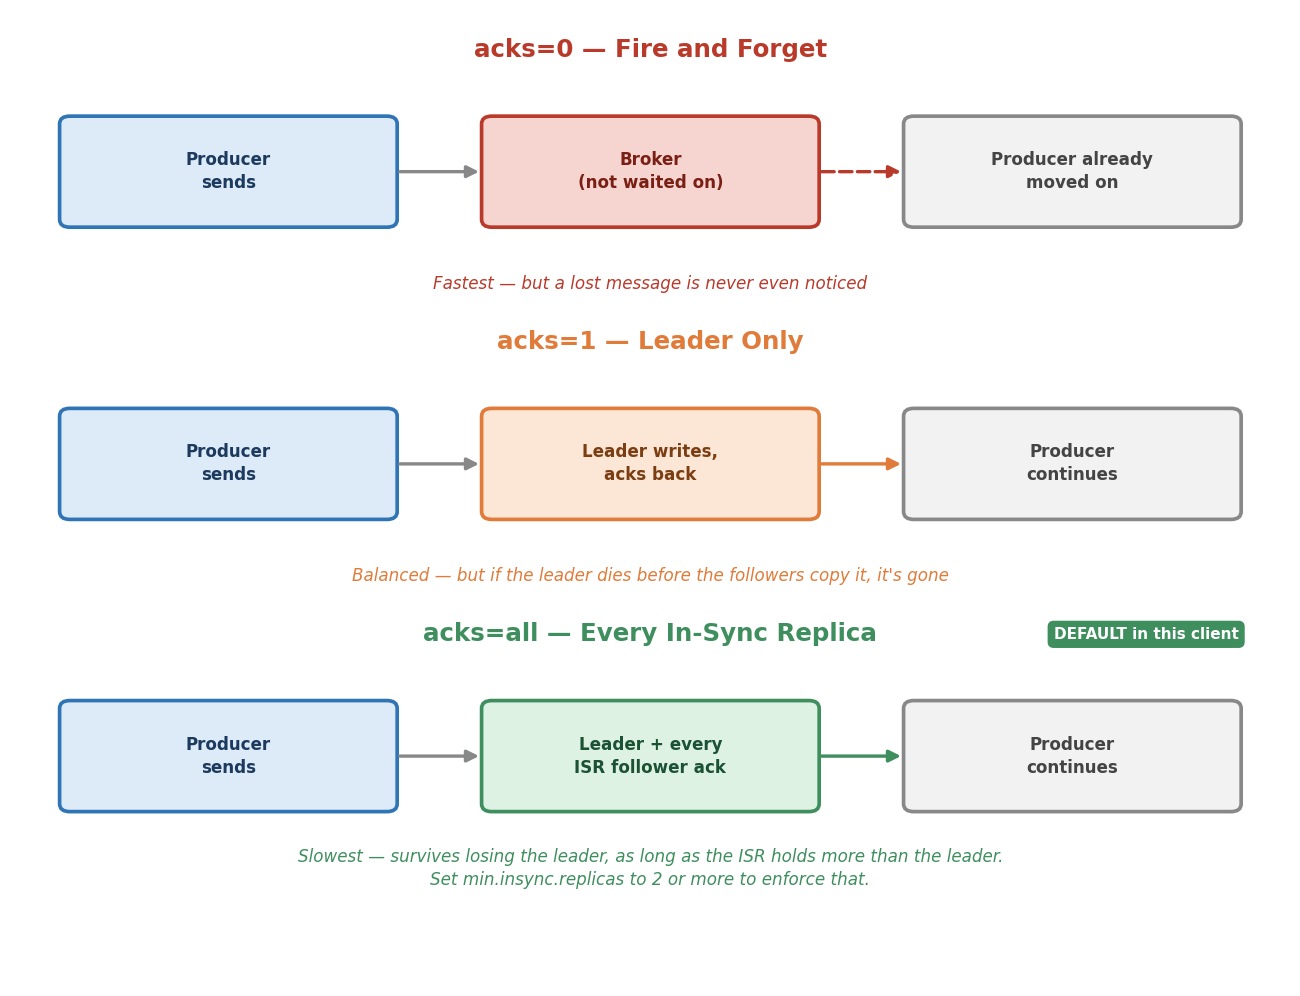 Three acks levels
acks=0 waits for nothing. The producer sends and moves on. It is the fastest and the riskiest. If a message never reaches the broker, your code has no way to know. Use it only for data you can afford to lose.
acks=1 waits for the partition leader to write the message and confirm. It is quick and reasonably safe. But there is a real gap. If the leader fails before the followers copied the message, the message is gone, even though the producer was told it succeeded.
acks=all waits for every replica that is currently in sync (the ISR) to confirm. It is the slowest of the three. But it survives losing the leader, because every in-sync copy already has the message.
Output / NoteWhich one is the default? In the Java client of Kafka 4.3.1, the default is
acks=all. Older articles sayacks=1. That was true for older versions. If you seeacks=1in a config today, someone chose it. The benchmark class below setsacksto 1 explicitly, on purpose, to represent the faster setting.
Is acks=all always a full guarantee?
Only if the ISR really contains more than the leader. If followers fall out of sync, "all in-sync replicas" can shrink to just the leader. Then acks=all is no better than acks=1. The broker setting min.insync.replicas protects you from this. For example, with min.insync.replicas=2, a write is refused when fewer than two replicas are in sync. For data you cannot lose, use acks=all together with min.insync.replicas of 2 or more.
Is there a link to idempotence?
Yes. Remember from the last lecture: idempotence needs acks=all. If you set acks=1 and say nothing about idempotence, the producer quietly switches idempotence off. So changing acks for speed also gives up the protection against duplicates. Keep that in mind when you tune.
Knob 5: buffer.memory and max.block.ms — When the Buffer Is Full
In the first lecture, you learned that send() only puts the message into a buffer. How big is that buffer?
By default, the producer may use 32 MB of memory to hold messages that wait to be sent. This is buffer.memory. Batches wait there, and they leave as the sender thread sends them.
What if your code produces faster than the brokers can take the data?
The buffer fills up. Then something interesting happens. send() does not fail at once. It blocks: it makes your thread wait, until the sender has freed some space. This slows your loop down to the speed of the cluster. It is called backpressure, and it is a kind of protection.
But send() does not wait forever. max.block.ms is the limit. Its default is 60 seconds. If there is still no space after 60 seconds, the message fails with a BufferExhaustedException (a kind of TimeoutException). The failure is reported the usual way: through the callback, and through the Future. Your code must handle it.
java// This is an example. It is not part of the benchmark class. producer.send(record, (metadata, exception) -> { if (exception instanceof BufferExhaustedException) { // The producer could not make room for 60 seconds. // Slow down the source, or give the producer more memory. } });
The same max.block.ms also limits how long the very first send() may wait for the topic's metadata. You saw that first send() was slow in the first lecture. If the cluster cannot be reached, or the topic cannot be found, that wait ends with a TimeoutException after 60 seconds.
Do we have to call anything to keep delivery reports moving?
No. The sender thread runs your callbacks by itself, so there is nothing extra for you to call. But callbacks share that one thread. A slow callback slows down all sending.
Let's Measure It, Not Just Reason About It
Now let's see the effect on your own cluster.
The Benchmark Class
The class has one producer, and three sets of settings. You choose the set with a program argument. Each set is one line in a small table:
javaprivate static final String TOPIC = "clickstream-benchmark"; private static final int NUM_MESSAGES = 200_000; /** The four settings we compare. */ private record Scenario(String acks, int lingerMs, int batchSizeBytes, String compression) { } private static final Map<String, Scenario> SCENARIOS = Map.of( // Kafka's own defaults for linger, batch size and compression. Only acks is our choice: 1. "baseline", new Scenario("1", 5, 16384, "none"), // Built for speed: wait longer, allow bigger batches, compress them. "throughput", new Scenario("1", 50, 131072, "lz4"), // Built for safety: the baseline, but every in-sync replica must confirm. "durability", new Scenario("all", 5, 16384, "none"));
Let's read the three scenarios:
baseline: the plain settings.linger.ms(5),batch.size(16 KB) andcompression.type(none) are the defaults.acksis set to 1, which is not the default. We choose it as the "fast" starting point.throughput: built for speed. It waits 50 ms, allows batches of 128 KB, and compresses them withlz4.durability: built for safety. It is thebaselinewith one change:acks=all.
Why is durability so similar to baseline?
On purpose. If a scenario changes several settings at once, you cannot tell which one made the difference. Here, comparing baseline and durability shows the cost of acks=all, and nothing else. For the same reason, the class switches idempotence off in all three scenarios. Otherwise, acks=all would bring idempotence back, and we would measure two things.
The class then reads the chosen scenario, and puts its four values into the producer config:
javaconfig.put(ProducerConfig.ACKS_CONFIG, scenario.acks()); config.put(ProducerConfig.LINGER_MS_CONFIG, scenario.lingerMs()); config.put(ProducerConfig.BATCH_SIZE_CONFIG, scenario.batchSizeBytes()); config.put(ProducerConfig.COMPRESSION_TYPE_CONFIG, scenario.compression()); // Off in every scenario, so that the settings above are the only difference between runs. config.put(ProducerConfig.ENABLE_IDEMPOTENCE_CONFIG, false);
And it sends 200,000 events, and measures the time:
java// Fetch the topic's metadata first, so the clock below measures only the sending. producer.partitionsFor(TOPIC); long start = System.nanoTime(); for (int i = 0; i < NUM_MESSAGES; i++) { ClickEvent event = new ClickEvent( "user-" + (i % 500), "page_view", System.currentTimeMillis() / 1000.0); producer.send(new ProducerRecord<>(TOPIC, String.valueOf(i % 500), event), (metadata, exception) -> { if (exception != null) { failures.incrementAndGet(); } }); } producer.flush(); double elapsedSeconds = (System.nanoTime() - start) / 1_000_000_000.0;
Wait, the key is String.valueOf(i % 500) but the user ID inside the event is "user-" + (i % 500). Is that a bug?
No, just two different-looking strings built from the same number. The key only has to be consistent per user, so that every event for the same number keeps landing on the same partition. It does not have to match the text inside the event's own fields. We kept the key plain here because this benchmark is about raw throughput, not about routing — the partitioning lecture is where the key's text actually matters.
Notice the differences from earlier producers. There is no sleep, so the loop runs as fast as it can. The callback counts only failures. And we ask for the topic's metadata before starting the clock. Remember that the first send() is slow because of the metadata. If we did not do this, that one-time wait would be part of every result.
Step 1: Start Your Cluster
powershelldocker compose start docker ps
Step 2: Create a Dedicated Benchmark Topic
powershelldocker exec -it kafka-1 bash
bashexport PATH=$PATH:/opt/kafka/bin
bashkafka-topics.sh --create \ --topic clickstream-benchmark \ --bootstrap-server kafka-1:29092 \ --partitions 3 \ --replication-factor 3
Then leave the broker shell with exit.
Step 3: Create Three Run Configurations in IntelliJ
The class needs to know which scenario to run. We give it as a program argument. In IntelliJ, you store this in a run configuration.
- Open
ThroughputBenchmarkand click the green triangle next tomain, then Run 'ThroughputBenchmark.main()'. It only prints a usage message, because we gave no argument. But it creates a run configuration for us. - Open the menu Run → Edit Configurations…, and select
ThroughputBenchmark. - Find the field Program arguments. (If you do not see it, click Modify options and tick Program arguments.) Type
baseline. Change the Name at the top tobenchmark-baseline. Click Apply. - With the configuration selected, click the Copy icon at the top of the list. Set the copy's name to
benchmark-throughputand its argument tothroughput. - Copy again. Name it
benchmark-durability, with the argumentdurability. Click OK.
Now you have three entries in the run-configuration list at the top of the window.
Step 4: Run All Three Scenarios
Run them one after the other: select benchmark-baseline in the list, click the green triangle, wait until it finishes, and then the next one.
Each run prints how long it took and how many messages per second. Write down all three numbers.
Output / NoteA warning about native access. With
lz4(and alsosnappyorzstd) on a new JDK, you may see aWARNINGthat mentions--enable-native-access=ALL-UNNAMED. Newer JDKs warn when a library uses native code. It is harmless, and the benchmark still works. To silence it, open the run configuration, click Modify options → Add VM options, and type--enable-native-access=ALL-UNNAMED.
Step 5: Read Your Results Honestly
Please read your numbers with care.
- This is a small cluster on your own laptop, not production hardware on a real network. The absolute numbers mean nothing in the real world. Replication between containers on one machine is almost free, so the cost of
acks=alllooks much smaller than it would in production. - Every run starts a fresh JVM, and the first seconds of a Java program are slower while the JVM warms up. So the first run of a day can be slower than the next ones.
- Timing has noise. Run each scenario three times and compare. The order can change from one run to the next. If two scenarios are within a few percent of each other, you cannot say that one is faster.
throughputchanges several settings together (linger, batch size and compression), because that is how they are used in practice. To measure one knob alone, change only that one in the table and run again.baselineanddurabilityalready do this foracks.
Want a clearer signal? Change NUM_MESSAGES at the top of the file. A larger number reduces noise. A number so large that your laptop cannot keep up will fill the buffer from Knob 5. Then send() blocks, and your run gets slower. That is the backpressure you just read about, in action.
What matters is the method: change one thing, measure, compare. Do not tune by guessing.
Step 6: Stop Your Cluster
powershelldocker compose stop
Common Producer Pitfalls in Production
These mistakes show up constantly in real systems.
Using acks=0 for anything that matters. It is fast, but silent data loss is not a possibility. Sooner or later it is a certainty. Keep it for data you can afford to lose.
Believing acks=1 is the default. The default is all. If you see acks=1 in a config, someone chose it. And remember that it can also switch idempotence off.
Never checking the delivery callback. send() not throwing an error tells you nothing about delivery. Errors arrive in the callback, later. Code that ignores exception can run for months while hiding real message loss.
Calling send(...).get() for every message. It waits for the answer each time. Batching is lost, and the producer becomes very slow.
Slow work in the callback. It runs on the sender thread and slows down all sending.
Not closing the producer before the program exits. Messages still in the buffer are lost. Try-with-resources, or flush(), prevents this.
Using gzip in a latency-sensitive pipeline. It compresses well, but it is the slowest common codec. For most high-throughput pipelines, lz4 or snappy is a better default.
Trusting acks=all without min.insync.replicas. If the ISR shrinks to the leader, acks=all is only as safe as acks=1.
Making batch.size huge. Memory is reserved for every batch. With many partitions, the cost adds up.
Tuning blindly. Guessing at linger.ms or batch.size instead of measuring them on your own workload and cluster.