How to Debug Notebooks
In this lecture, let's learn how to debug code inside the Databricks notebook environment.
Setup
Create a new notebook in your exercises folder, and name it debug-notebook. We'll need some code to actually debug — here's a simple mix of Python and Spark code:
pythonfrom pyspark. sql import Row from pyspark. sql. functions import lit from datetime import datetime, date df = spark. createDataFrame( [ Row(id=1, name='Jonas', birthday=date(2000, 1, 1)), Row(id=2, name='Mary', birthday=date(2000, 2, 1)), Row(id=4, name='Susan', birthday=date(2000, 3, 1)) ]) x = 20 y = 30 z = 40
This creates a small DataFrame manually using Row objects, along with a few simple variables (x, y, z) — enough to actually see debugging in action.
Step 1: Confirm the Debugger Is Enabled
Debugging is usually enabled by default, but it's worth double-checking. Go to Settings → Developer, and look for "Python Notebook Interactive Debugger." Make sure it's switched On. This is on by default in the Databricks Free Edition, but if you're on a different setup and it's off, turn it on before continuing.
Step 2: Attach a Cluster
As always, you need a cluster attached to actually run (or debug) code. Attach a serverless cluster to this notebook.
Step 3: Set a Breakpoint and Start Debugging
Click into the cell you want to debug. Move your cursor to the line where you want execution to pause, and click in the gutter (left margin) to set a breakpoint — a red dot appears next to that line.
From the cell's toolbar, click Debug cell (or the equivalent debug icon) to start debugging.
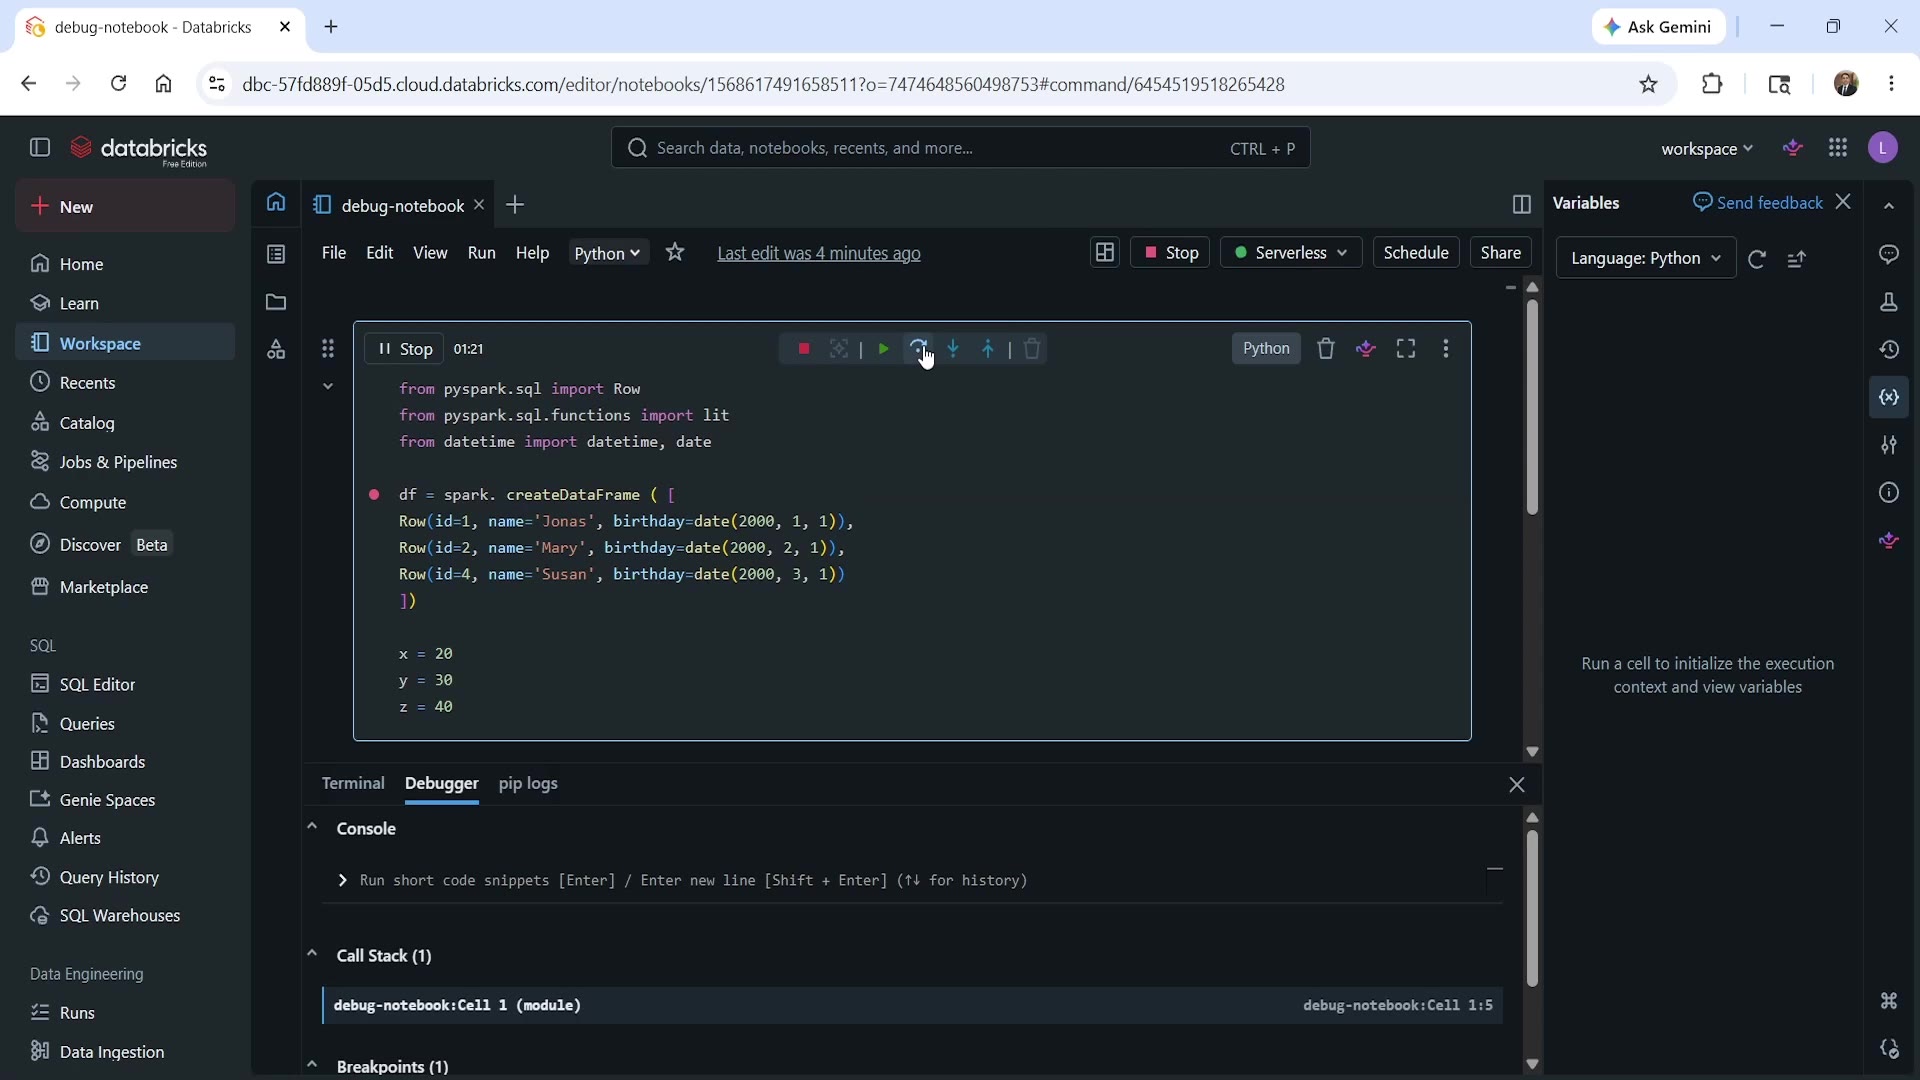 Debugger layout with breakpoint set
Once debugging starts, you'll see the layout change:
- Right side — Variables panel: shows the current state of variables as execution progresses. You can toggle this panel's visibility.
- Bottom — Debugger panel: includes tabs for Console, Call Stack, and Breakpoints.
- Toolbar controls: Stop debugging, Continue execution, Step over (next line), Step in, Step out.
Execution pauses right at your breakpoint, waiting for your next move.
Step 4: Step Through the Code
Use Step Over (next line) to move through the code one line at a time. As you do:
- After the
df = spark.createDataFrame(...)statement executes,dfappears in the Variables panel — showing its schema (columns:id,name,birthday). Note: it shows the structure, not the actual row values yet — we'll get to that. - Step again, and
xappears in Variables, with its value:20. - Step again, and
yappears, with value30.
This lets you confirm, line by line, exactly what state your code is in — genuinely useful for catching bugs or unexpected values before they cascade into later cells.
Step 5: Run Code in the Debug Console
The Debugger → Console tab lets you run ad hoc code, using whatever has already executed so far — this is extremely useful for inspecting values beyond just what's shown in the Variables panel.
For example, to see the actual contents of df (not just its schema), type directly into the console:
pythondf.show()
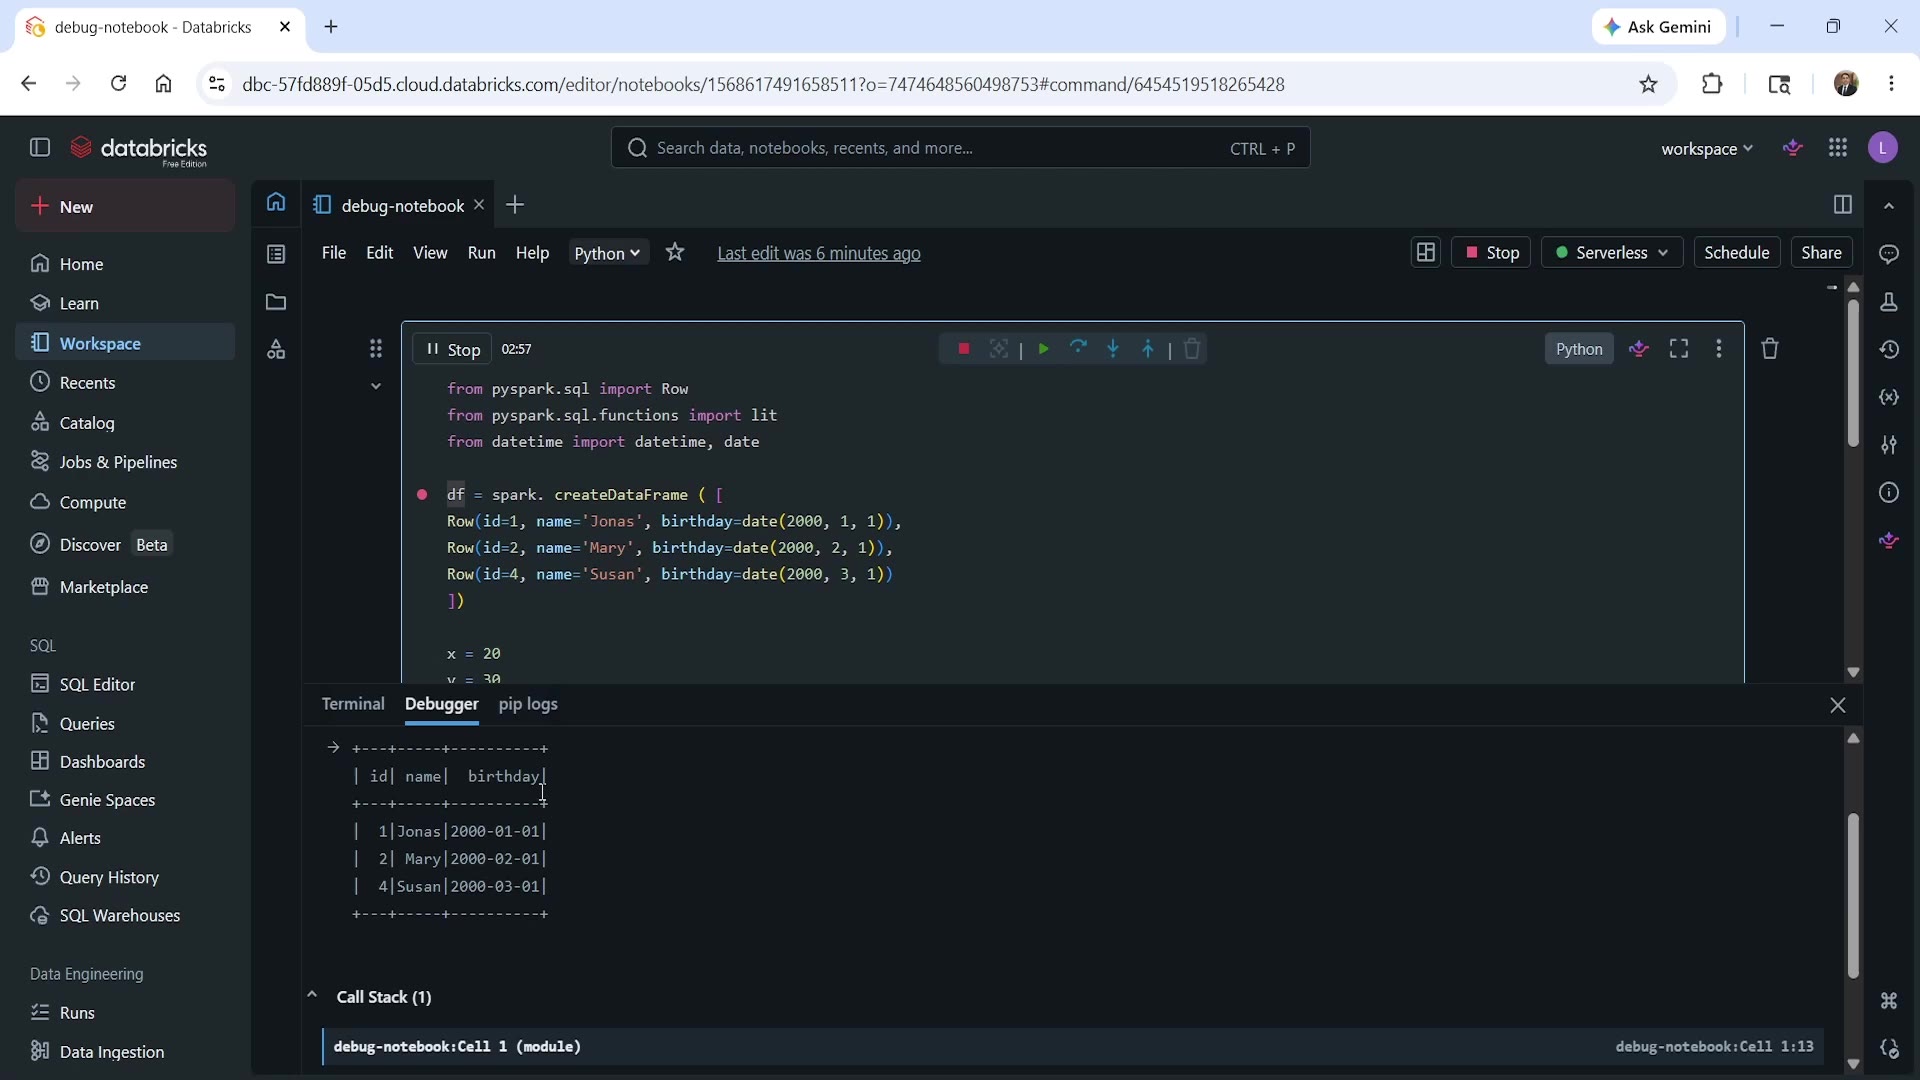 Debug console showing df.show() output
Press Enter, and you get the real output — a formatted table showing all three rows (Jonas, Mary, Susan) with their id, name, and birthday values.
You can run other quick checks the same way — for example:
pythonprint(x)
This prints the current value of x (20) directly in the console. You can also selectively inspect part of a DataFrame:
pythondf.show(2)
This would show just the first 2 records — handy when you only want a quick peek rather than the full output.
Step 6: Finish Debugging
Once you're done inspecting, click Continue execution to let the rest of the code run normally, or Stop debugging to end the session entirely.
You can also remove breakpoints once you no longer need them, and disconnect or terminate the cluster when you're finished.
A cost note: on the Databricks Free Edition, the cluster is free, so this doesn't matter much. But on a paid/premium account, it's good practice to terminate your cluster after debugging — even a serverless one — to avoid incurring unnecessary compute cost.
Summary
| Feature | What It Does |
|---|---|
| Settings → Developer → Python Notebook Interactive Debugger | Must be On to enable debugging |
| Breakpoint (click in the gutter) | Pauses execution at a specific line |
| Debug cell | Starts a debugging session for that cell |
| Variables panel | Shows live variable state as you step through code |
| Step over / Step in / Step out | Controls for moving through code line by line |
| Debug Console | Run ad hoc code using the current execution state (e.g., df.show()) |
| Continue execution / Stop debugging | Resume normal execution, or end the debug session |
That's how to debug code inside a Databricks notebook — a genuinely useful skill for tracking down issues in your Spark and Python code without relying purely on print() statements.
See you again. Keep learning, and keep growing!