Your First Job — Pipeline Task, Schedule, and Job-Level Config
Last lecture covered the vocabulary: job, task, trigger. Now let's build one for real, wiring the medallion pipeline from the previous chapter into a scheduled, production-shaped job.
Creating the Job
A job can be created from a few places — the general "New" menu, or from Jobs & Pipelines — and all
of them land you in the same job editor UI. As soon as it opens, a top-level job container already
exists, with a default name like "New Job [date]." Rename it to something meaningful — this course
uses medallion-orchestration-job.
The editor has two areas: a collapsible job-details panel (schedule, triggers, parameters, tags, notifications, permissions, advanced settings), and the main canvas, where tasks and their dependencies get built. A brand-new job always starts with one default notebook-type task — every job needs at least one task, since there's otherwise nothing to run.
Task 1: The Pipeline Task
Edit the default task to do what this job is actually for: orchestrating the medallion pipeline built in the previous chapter.
- Task name:
run_sdp_pipeline - Type: Pipeline — this is the task type that operationalizes a Lakeflow SDP pipeline. Other types exist (notebook, Python script, Python wheel, SQL, dbt, JAR, visual data preparation), but pipeline is what's needed here.
- Pipeline: select the SDP pipeline built earlier in the course (
sdp-medallion-pipeline).
That's the bare minimum — task name, task type, and which pipeline to run. Save the task, and it appears in the job's DAG view. With one task defined, the job is technically already runnable.
Setting the Trigger
Expand the job details panel and add a trigger. Several trigger types are available (scheduled, file arrival, table update, continuous, model update) — this job uses Scheduled.
Scheduling can be defined as a simple interval (e.g., every 1 day) or as a proper cron-backed schedule — a specific time and time zone, which is what this job uses: daily at 20:00 (8 PM), in a chosen time zone. The UI can show the underlying cron syntax if you want to see it, but for this kind of standard daily schedule, you don't need to write cron by hand.
Setting Job Notifications
Job-level notifications live under Job notifications → Edit notifications. Adding a notification requires a destination — the most common is email, though Slack, webhooks, PagerDuty, and Microsoft Teams destinations can also be configured by a workspace admin under workspace notification settings and reused across jobs.
For this job, an email notification was added, firing on failure only — deliberately not on job start or on every successful completion. The reasoning: a successful run needs no attention; only a failure does. Getting a daily "job succeeded" email for months is noise, not signal.
Metric Thresholds: Warning and Timeout
Beyond simple pass/fail notifications, a job can also be monitored on duration. Under metric thresholds, Run duration is the most commonly used metric (streaming backlog metrics — bytes, duration, files, records — exist too, but are more specialized):
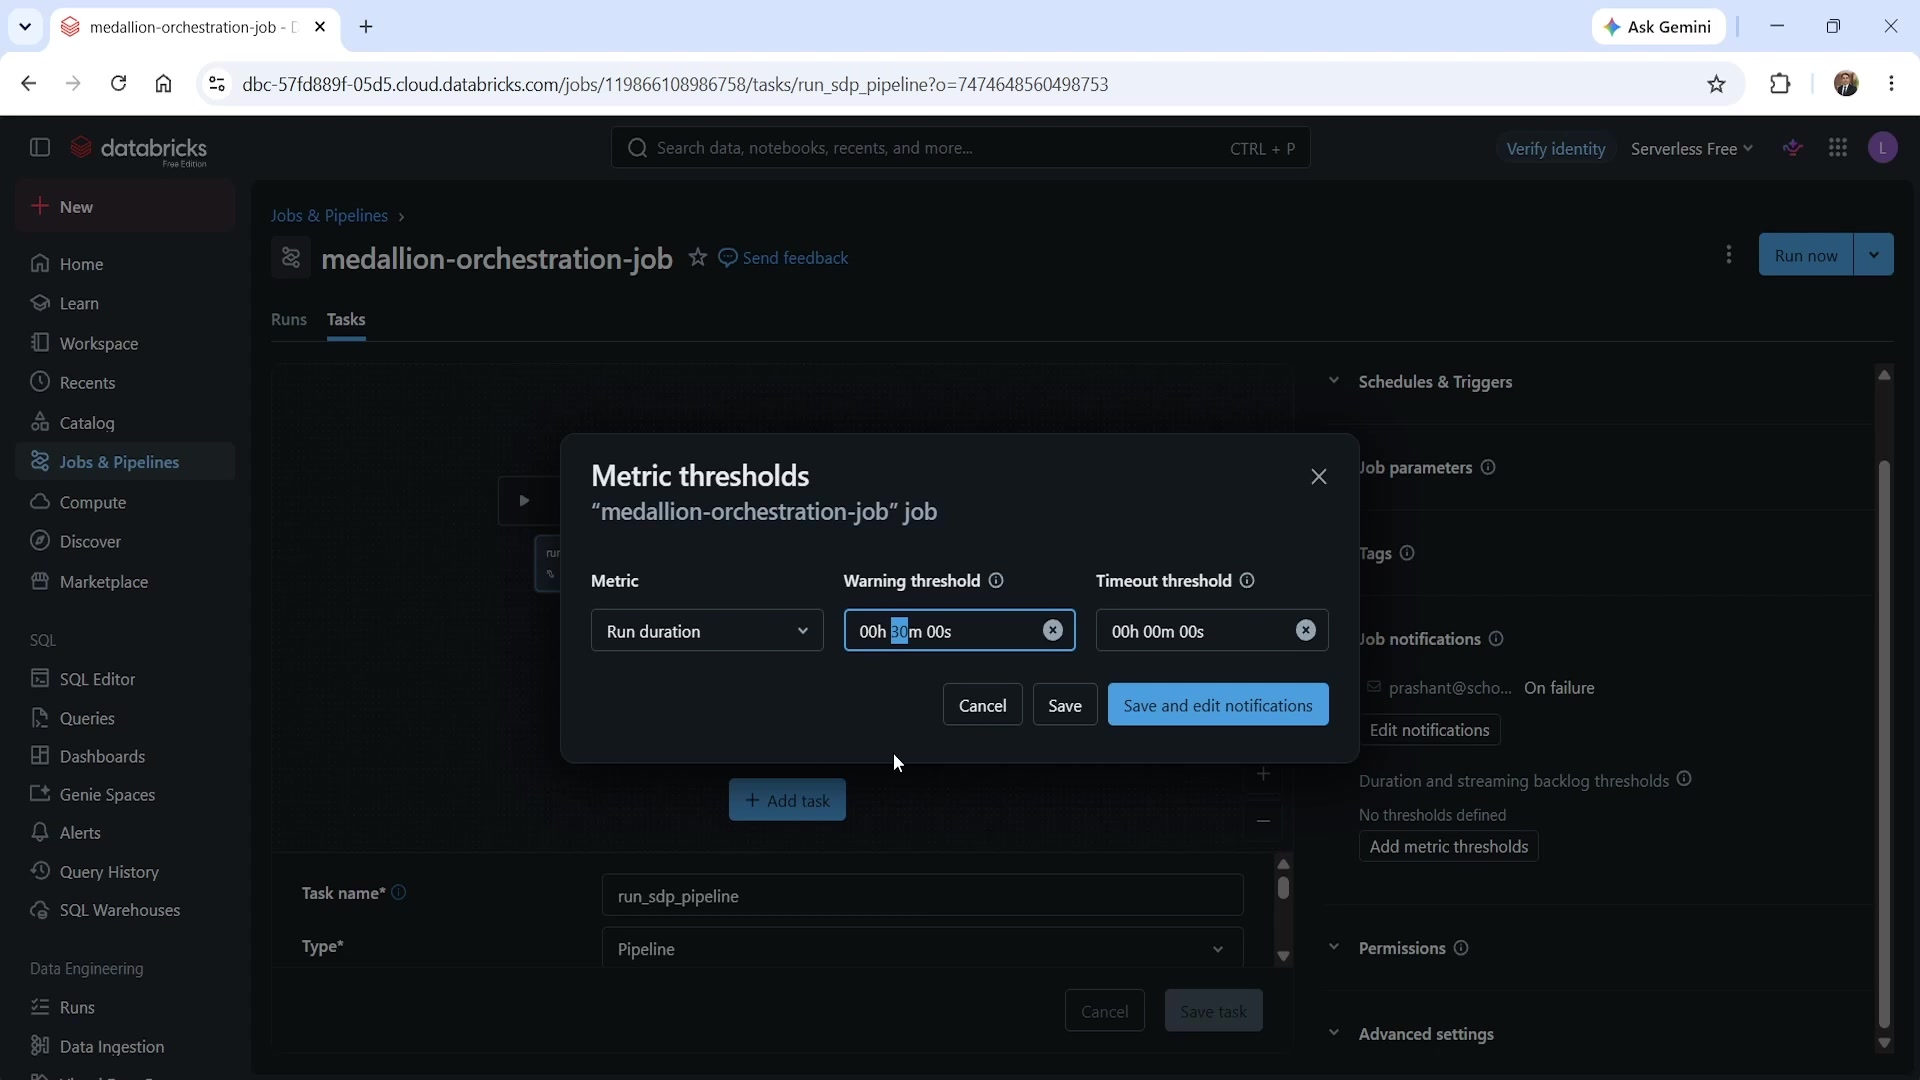 Metric thresholds — run duration warning and timeout
Two separate thresholds were configured here:
- Warning threshold — 30 minutes. This pipeline is expected to finish in a couple of minutes on the small dataset used during development, but a realistic production estimate (based on actual data volume) might be 15–20 minutes. A 30-minute warning threshold means: if the job is still running past that point, something is dragging — worth investigating, even though it hasn't technically failed.
- Timeout threshold — 60 minutes. If the job is still running after an hour, that's not a performance concern anymore — it's a clear sign something has hung, and the job should be terminated rather than allowed to run forever.
Once a duration warning threshold is set, it becomes available as a notification trigger too — so the same email notification can also fire specifically when a run breaches the 30-minute warning, separately from a hard failure.
Task 2: The Notebook Task (Data Quality Gate)
A job with a single task is completely valid — there's no rule against it. But most real jobs have more than one, and this job adds a second task: a data quality check that runs only after the pipeline succeeds.
- Task name:
dq_check_gold - Type: Notebook — since this is a small validation script that benefits from interactive development and output, not a pipeline or standalone script.
- Notebook: a notebook stored in the workspace, under
.../pipelines/notebooks/01-dq-check— kept alongside the pipeline itself for source-control consistency. - Compute: Serverless. Unlike the pipeline task — which already knows its own compute, because that's defined inside the pipeline — a notebook task needs its compute specified explicitly at the task level.
- Depends on:
run_sdp_pipeline. This is the critical setting: without it, both tasks would run in parallel, which defeats the purpose of a DQ gate. Setting this dependency meansdq_check_goldonly starts oncerun_sdp_pipelinesucceeds — and never starts at all if the pipeline fails. - Environment: left as the default job environment, rather than defining a separate one just for this task.
The DQ Check Notebook
Here's the actual notebook (01-dq-check), run as the dq_check_gold task:
pythondbutils.widgets.text("run_date", "2024-01-15", "Run Date") run_date = dbutils.widgets.get("run_date") table = "dev.dbx_course.gold_daily_revenue" print(f"Running DQ check for run_date={run_date}") df = spark.table(table).filter(f"order_date = '{run_date}'") # Check 1: table is not empty row_count = df.count() assert row_count > 0, f"FAIL: {table} has 0 rows" print(f"PASS: row_count = {row_count}") # Check 2: no null revenue null_revenue = df.filter("total_revenue IS NULL").count() assert null_revenue == 0, f"FAIL: {null_revenue} rows with null revenue" print(f"PASS: null_revenue = {null_revenue}") # Check 3: no negative revenue neg_revenue = df.filter("total_revenue < 0").count() assert neg_revenue == 0, f"FAIL: {neg_revenue} rows with negative revenue" print(f"PASS: neg_revenue = {neg_revenue}") # Publish row_count for downstream tasks dbutils.jobs.taskValues.set(key="row_count", value=row_count) print(f"\nAll DQ checks passed for {run_date}. {row_count} rows validated.")
A few things worth noting about how this notebook is written:
dbutils.widgets.text("run_date", ...)defines a parameter with a default value, rather than hardcoding a single date to check. This is what makes the notebook reusable across different job runs or backfills, instead of only ever validating one fixed date.- Three
assertstatements are the actual data quality gate: table not empty, no null revenue, no negative revenue. If any assertion fails, Python raises an exception, the notebook task fails, and — because of the dependency chain — the entire job is marked failed. That failure is exactly what triggers the job's failure email notification. dbutils.jobs.taskValues.set(...)publishesrow_countas a named value other tasks in the same job run can read. This notebook doesn't consume any task values itself, but it makes its own result available to whatever might run after it in a more elaborate version of this job later.
Running It
The job is scheduled for 8 PM, but during development, testing it manually via Run now is the practical way to validate everything actually works end to end. Watching the run through View runs shows the full picture:
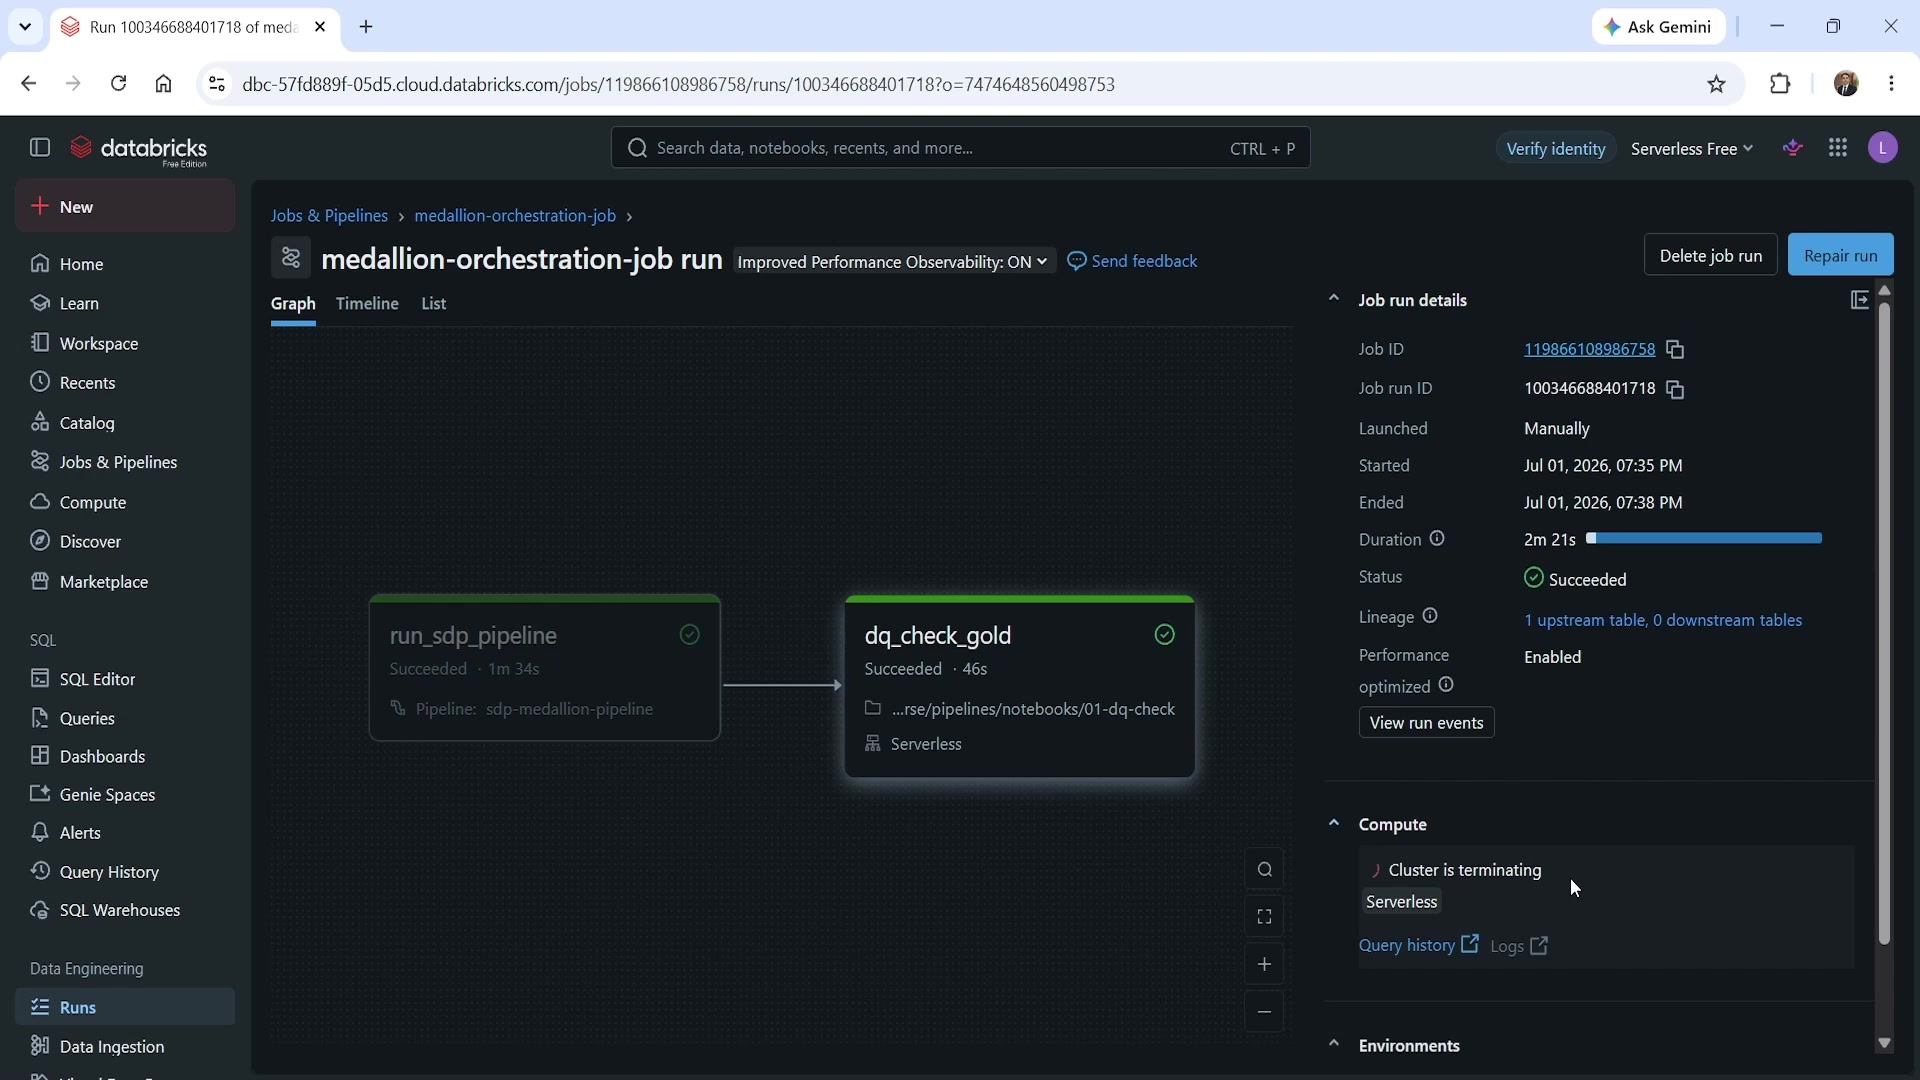 Job run — both tasks succeeded
run_sdp_pipeline completed in 1m 34s, followed by dq_check_gold in 46s — total job duration 2m
21s, well under the 30-minute warning threshold. From this view, either task's underlying details are
one click away: the pipeline task links straight into the same pipeline run UI covered in the
previous chapter, and the notebook task links into the notebook's actual execution, showing each
print statement's output — PASS: row_count = 4, PASS: null_revenue = 0, PASS: neg_revenue = 0, and the final All DQ checks passed message.
Checking the Runs tab afterward shows the job's run history as a duration chart, with the 30-minute warning threshold plotted as a visible reference line — making it easy to see at a glance how much headroom a run has, not just whether it passed or failed:
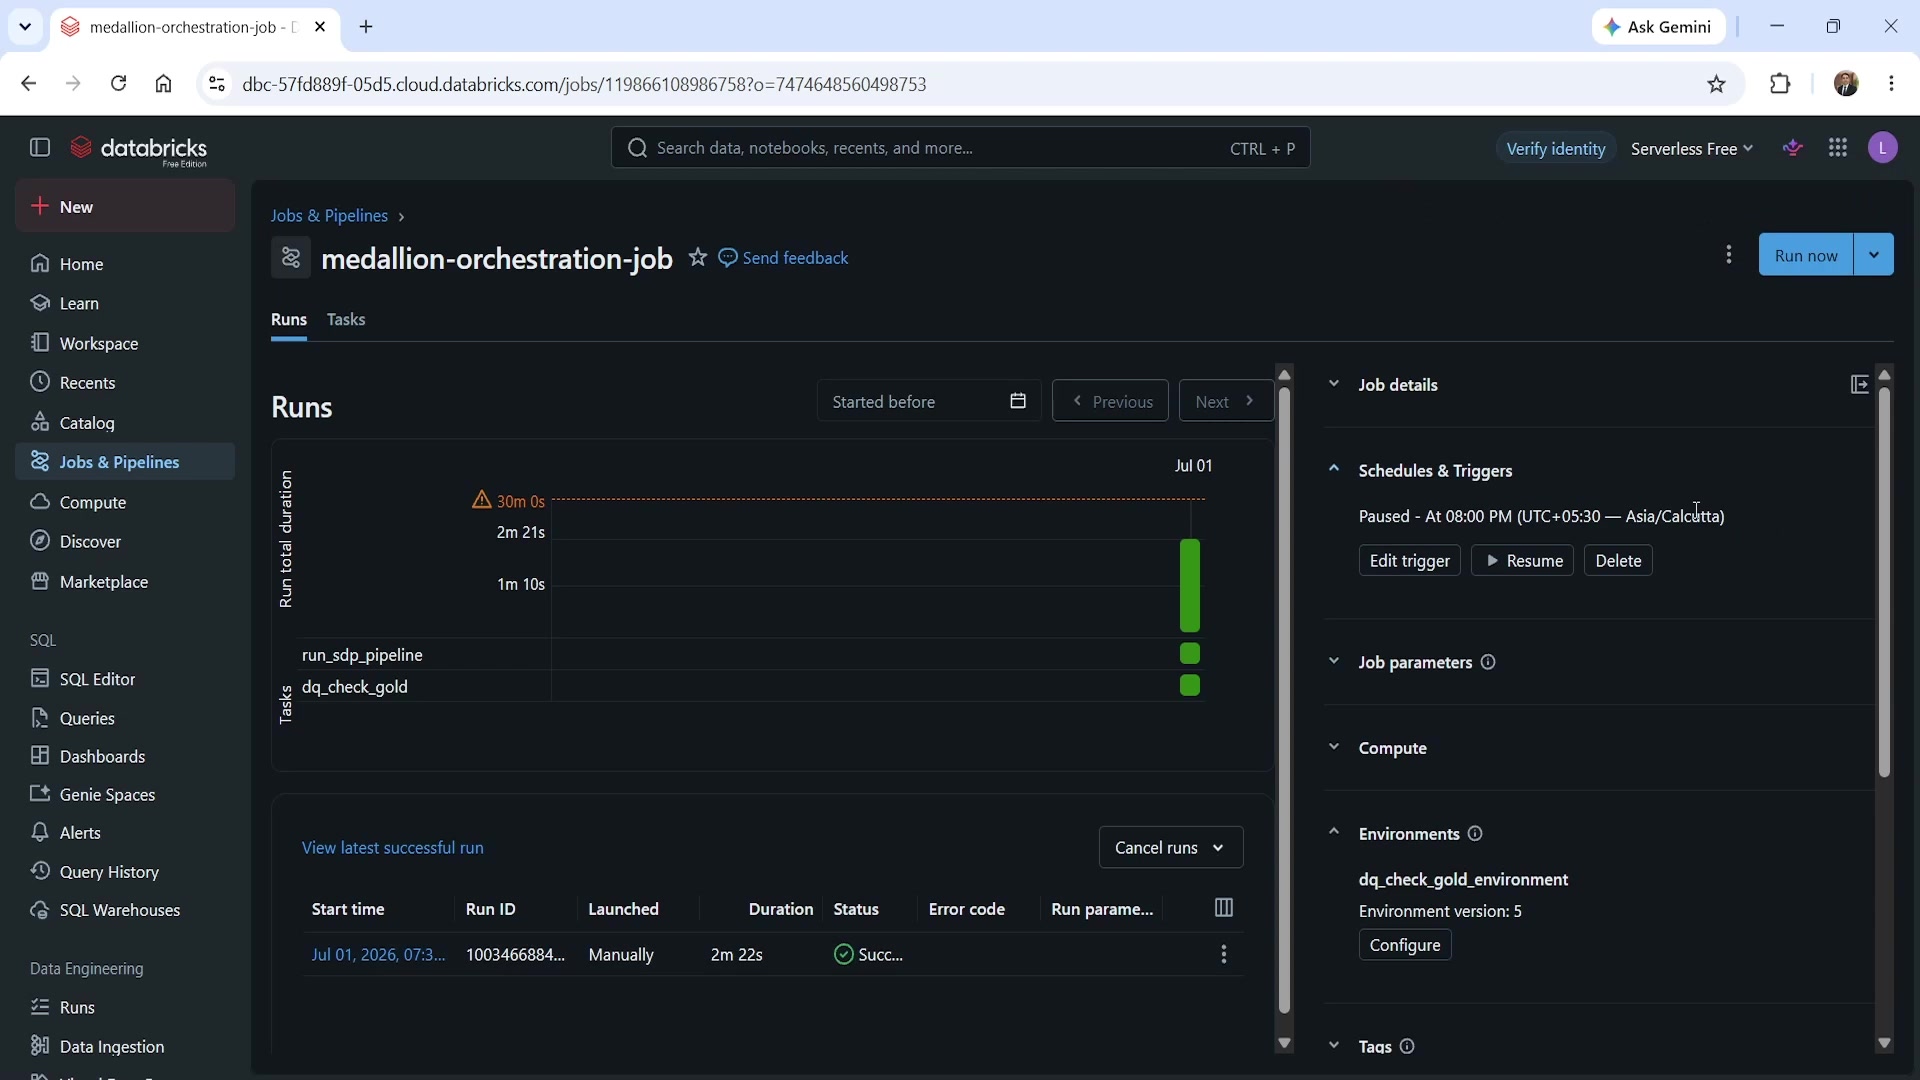 Job runs list with duration threshold chart and paused schedule
Since this job isn't meant to actually fire every evening during course development, the schedule was paused afterward via Edit trigger → Pause. In a real production deployment, there'd be no reason to pause it — the whole point of the schedule is for the job to run unattended.
Summary
| Concept | Key point |
|---|---|
| Job creation | Same editor UI regardless of entry point (New menu or Jobs & Pipelines) |
| Pipeline task | Operationalizes an SDP pipeline; compute is inherited from the pipeline itself, not set at the task level |
| Notebook task | Needs compute explicitly specified (serverless here); good fit for validation/reporting code |
| Task dependency | depends_on controls sequencing — without it, tasks run in parallel by default |
| Scheduled trigger | Cron-backed under the hood, but configured through a plain daily/hourly/etc. UI |
| Failure-only notifications | Deliberate choice — success emails are noise; failure emails are signal |
| Warning threshold | A soft signal something is slower than expected, without failing the job |
| Timeout threshold | A hard stop for jobs that have genuinely hung |
| DQ notebook pattern | Parameterized via widgets, gated via assert, results shared downstream via dbutils.jobs.taskValues.set |
| Assertion failure → job failure | An unhandled exception in a notebook task fails the task, which (via dependency) fails the whole job and triggers notifications |
| Pausing during development | Use "Pause" on the trigger, not deletion, to stop a schedule from firing while still testing |
This job is now a real, minimally production-shaped deployment: scheduled, monitored on duration, notified on failure, and gated by a data quality check — everything a single manual pipeline run in the editor didn't give us.
See you again. Keep learning, and keep growing!